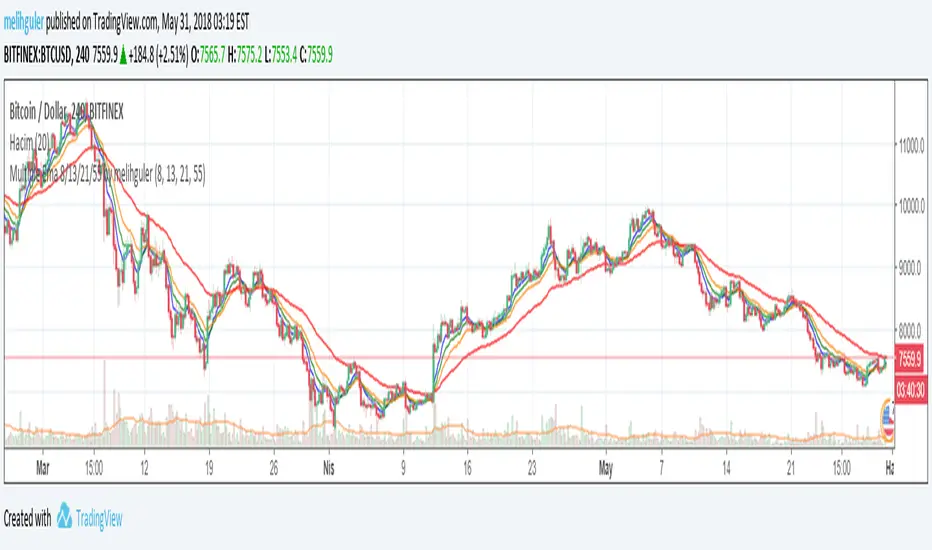
Multiple Ema 8/13/21/55 by melihgulerIn one graph, 4 different periods include EMA (8/13/21/55). It is not recommended for short-term investments. You can get efficient results using at least 4 hours chart.
It is not an investment recommendation. Your use is at your own risk.
Cerca negli script per "3 ema"

Multiple Ema 8/13/21/55 by melihgulerIn one graph, 4 different periods include EMA (8/13/21/55). It is not recommended for short-term investments. You can get efficient results using at least 4 hours chart.
It is not an investment recommendation. Your use is at your own risk.
Multiple Ema 8/13/21/55 by melihgulerIn one graph, 4 different periods include EMA (8/13/21/55). It is not recommended for short-term investments. You can get efficient results using at least 4 hours chart.
It is not an investment recommendation. Your use is at your own risk.


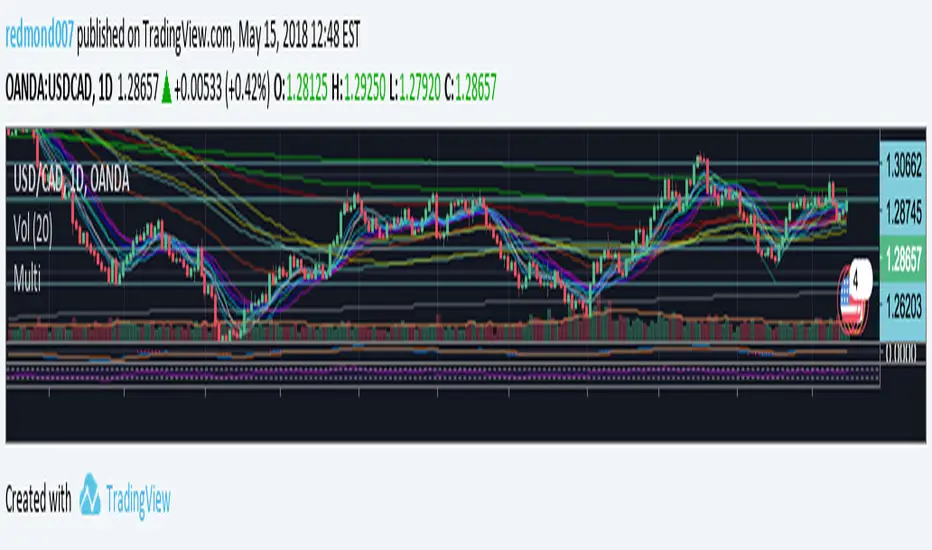
james16 EMAsThe EMAs used by james16 as support and resistance in his trading strategy. I'm adding 5 200 and 1200
These can be turned on and off and use SMA instead of EMA.
EMA Landscape - Part IIIIMultiple EMA's starting from 570 with increment of 3.
This indicator consists of 4 parts! Add them all to your chart.

EMA Landscape - Part IIIMultiple EMA's starting from 381 with increment of 3.
This indicator consists of 4 parts! Add them all to your chart.

EMA Landscape - Part IIMultiple EMA's starting from 192 with increment of 3.
This indicator consists of 4 parts! Add them all to your chart.
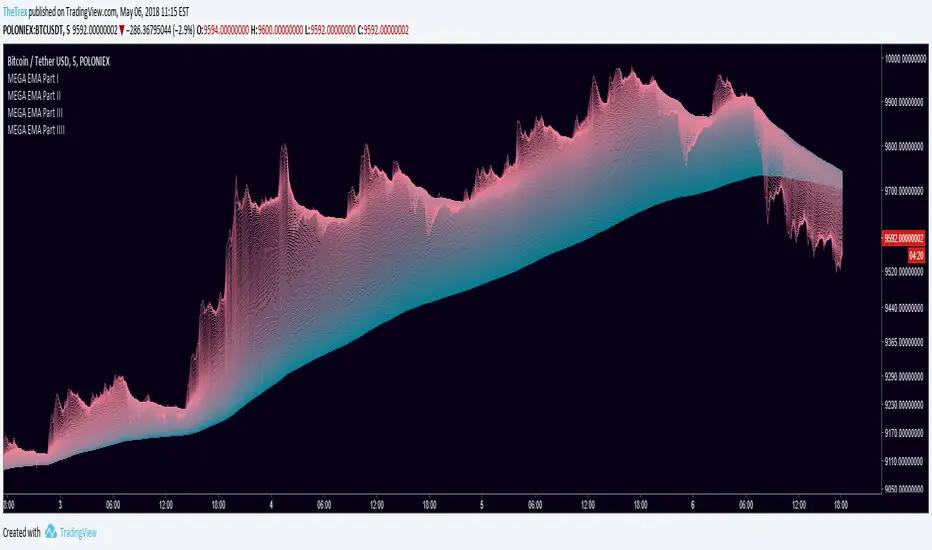
EMA Landscape - Part IMultiple EMA's starting from 3 with increment of 3.
This indicator consists of 4 parts! Add them all to your chart.


Fibonacci EMAs 8 13 21 55Plot 4 EMA based on fibonacci number
5+3 = 8
5 + 8 = 13
13 + 8 = 21
21 + 34 = 55
Quick Mafs :D
If you want to understand how to use them look at Philakone videos on youtube

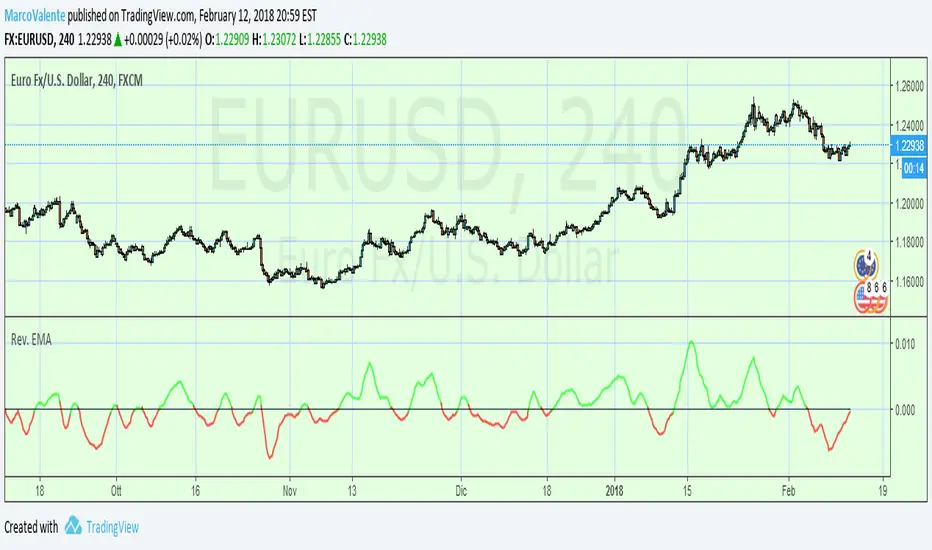
Reverse EMA “The Reverse EMA Indicator” , author John Ehlers presents very interesting filtering technique based on a Z-transform of the exponential moving average.

EMA 20/50/100/200Plots exponential moving average on four timeframes at once for rapid indication of momentum shift as well as slower-moving confirmations.
Displays EMA 20, 50, 100, and 200... default colors are hotter for faster timeframes, cooler for slower ones
Three EMAThree simple plotted ema lines all with a slightly different variable as well as calculation method.

EMA SpreadExponential Moving Average Spread is the percentage spread difference between EMA1 (Slow) and EMA2 (Fast) ie. the gap between two indicators slow and fast. Useful when used alongside EMA cross, MACD, and RSI to strengthen buy/sell signals.

MAX EMA FibonacciVisualizza in un unico indicatore fino a 5 EMA, di default è impostata la serie di Fibonacci (21,55,69,144,233)
